A/B testing is a randomized experimentation process, where we split users into 2 groups, and expose each group to different app configurations. If you have a hypothesis, which requires you to change one variable and measure the effect of this change, this is where you start.
You can use A/B testing to validate any hypothesis by adding ad units, segments (definition/behavior), add networks, bidding vs. waterfall, open auction optimizations, timeouts, etc.
To help you measure the effect of a change, we use Bayesian inference to state the probability of any one variant being the best overall. This way as an experiment generates more data, we will make a recommendation on the variant that is best overall and how likely is the variant to be best overall. This helps you take an informed and accurate decision quickly, without making the mistake of acting on early data.
We also help you understand how experiments are impacting other KPIs like retention rate and LTV as well as making experiments and variants available in Cohort Analysis.
To create an experiment first open the App Workspace. To open your App Workspace, click on All Apps, and then Select the App from the menu. Then go to Reports/Experiments, and click on Create Experiment. To create an A/B experiment, select A/B.

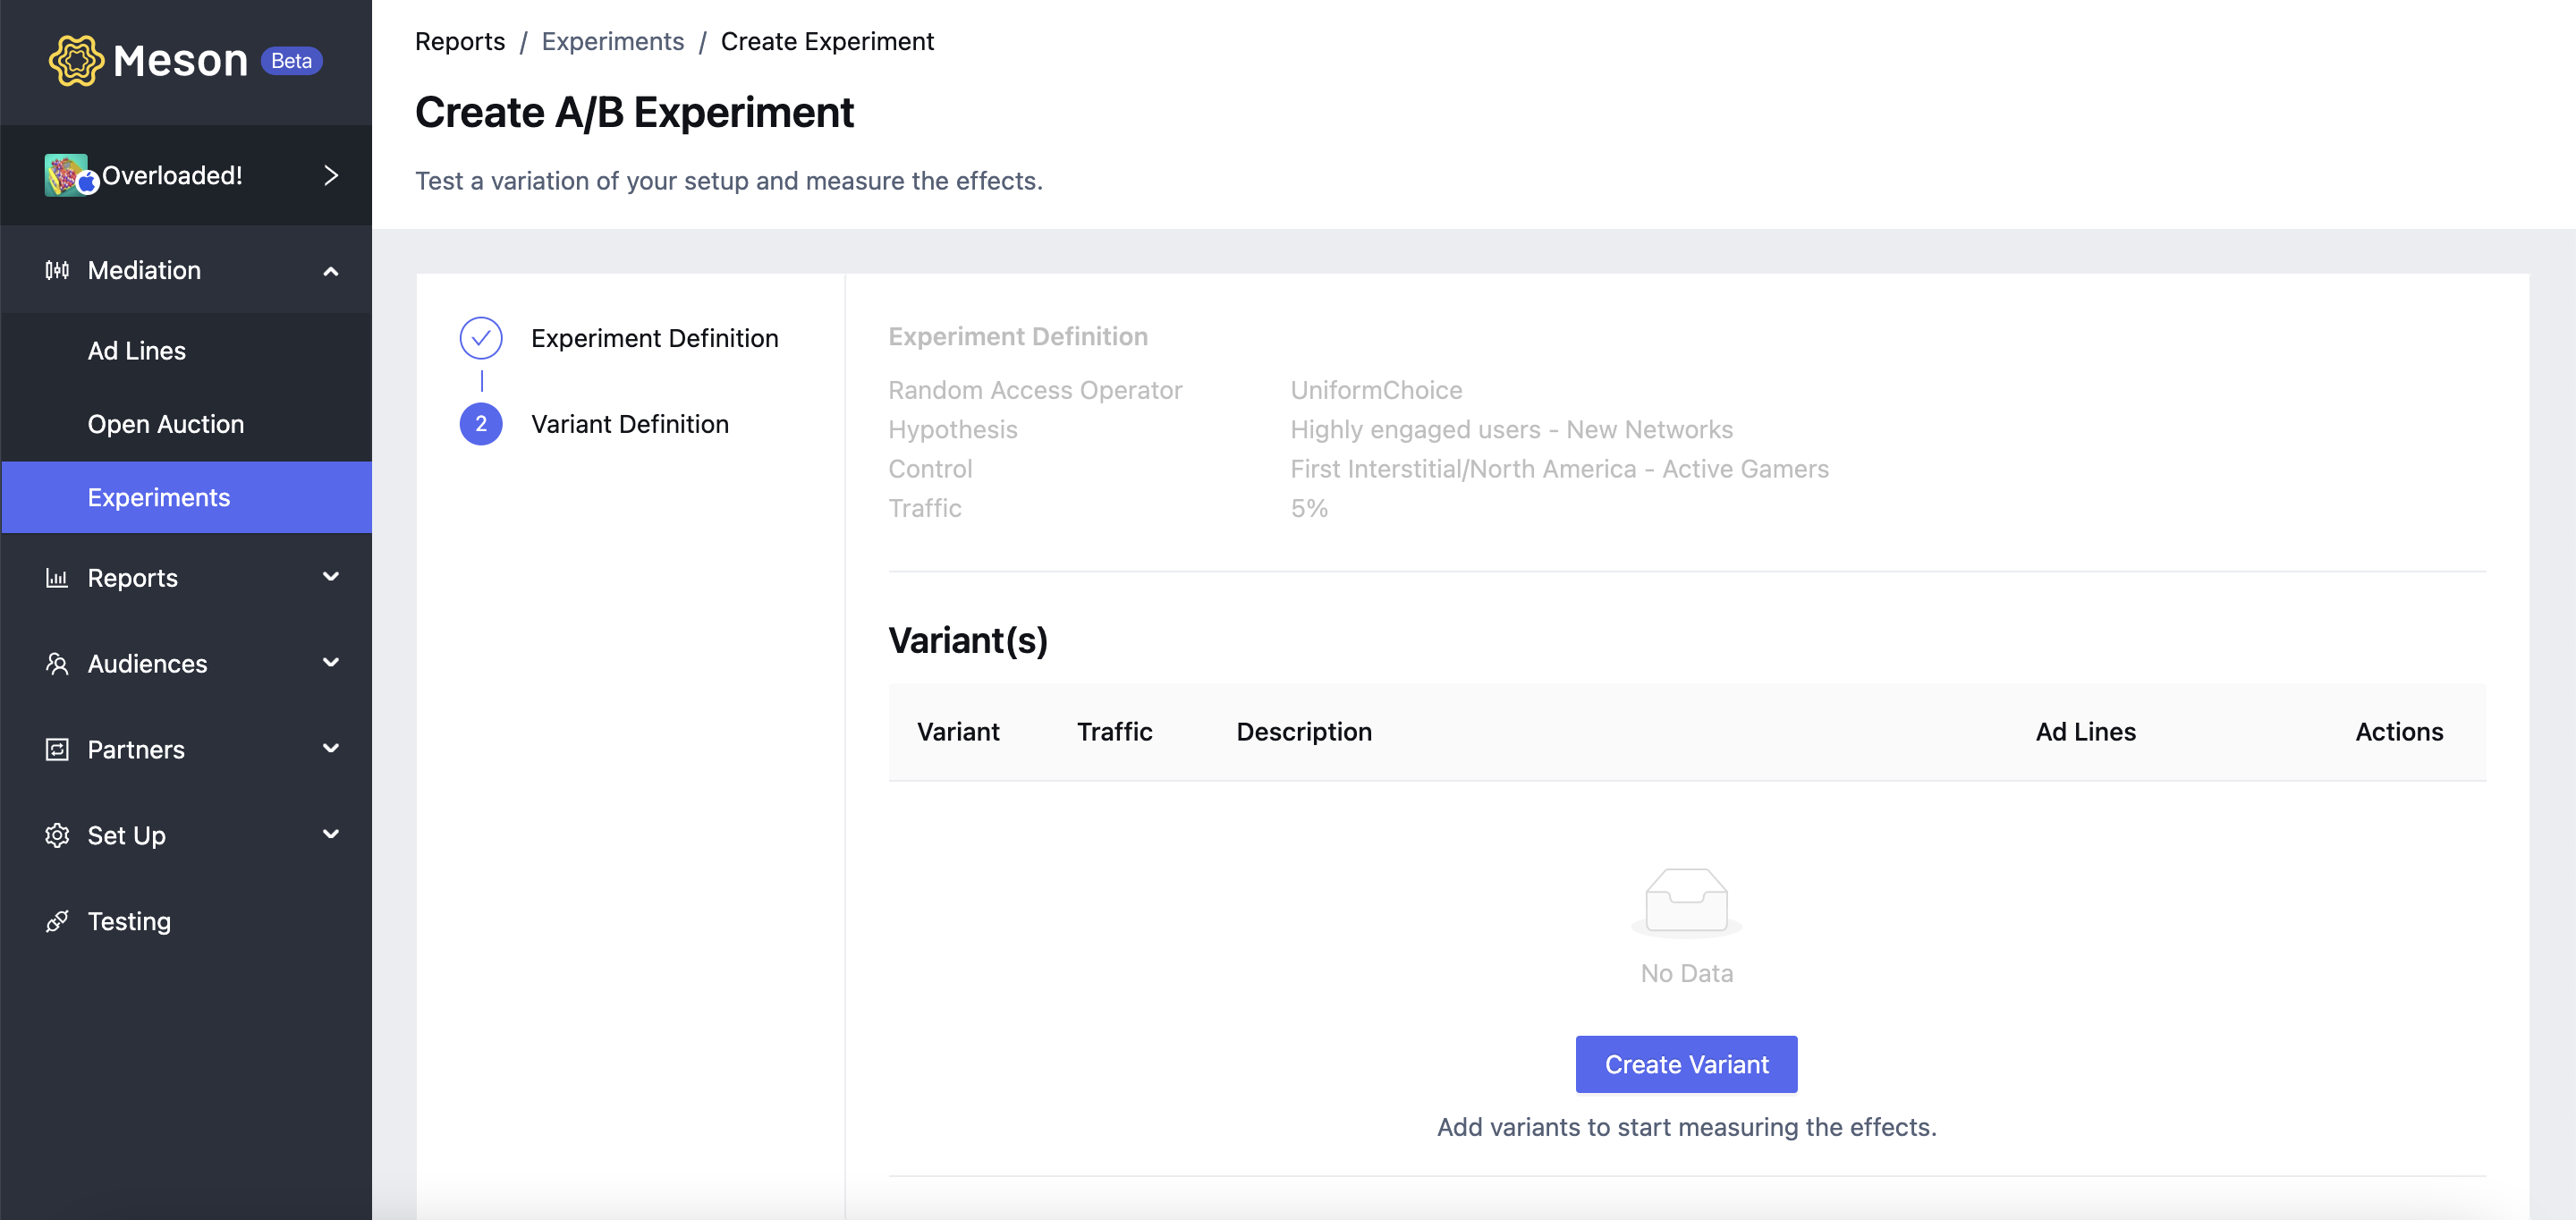
To define an experiment:
The size of the user group defines what percentage of eligible users will be exposed to a particular treatment. Please note users who are mapped to a particular treatment once are always exposed to the same treatment until the experiment is Live.
The targeting group selected for the control is the current active targeting group to that all eligible users are exposed.

To define a variant:
For accurate evaluation we recommend, that variant adline credentials (adunit id, placement id, zone id, tag id, etc..) are set up afresh with the respective networks.


To add ad lines for nonexistent networks, first, go to Partner/Networks and enable the network. Create new ad lines for the variant by clicking on Configure for each variant.

Experiments can be saved in the Draft state. To start an experiment click on Start Experiment.
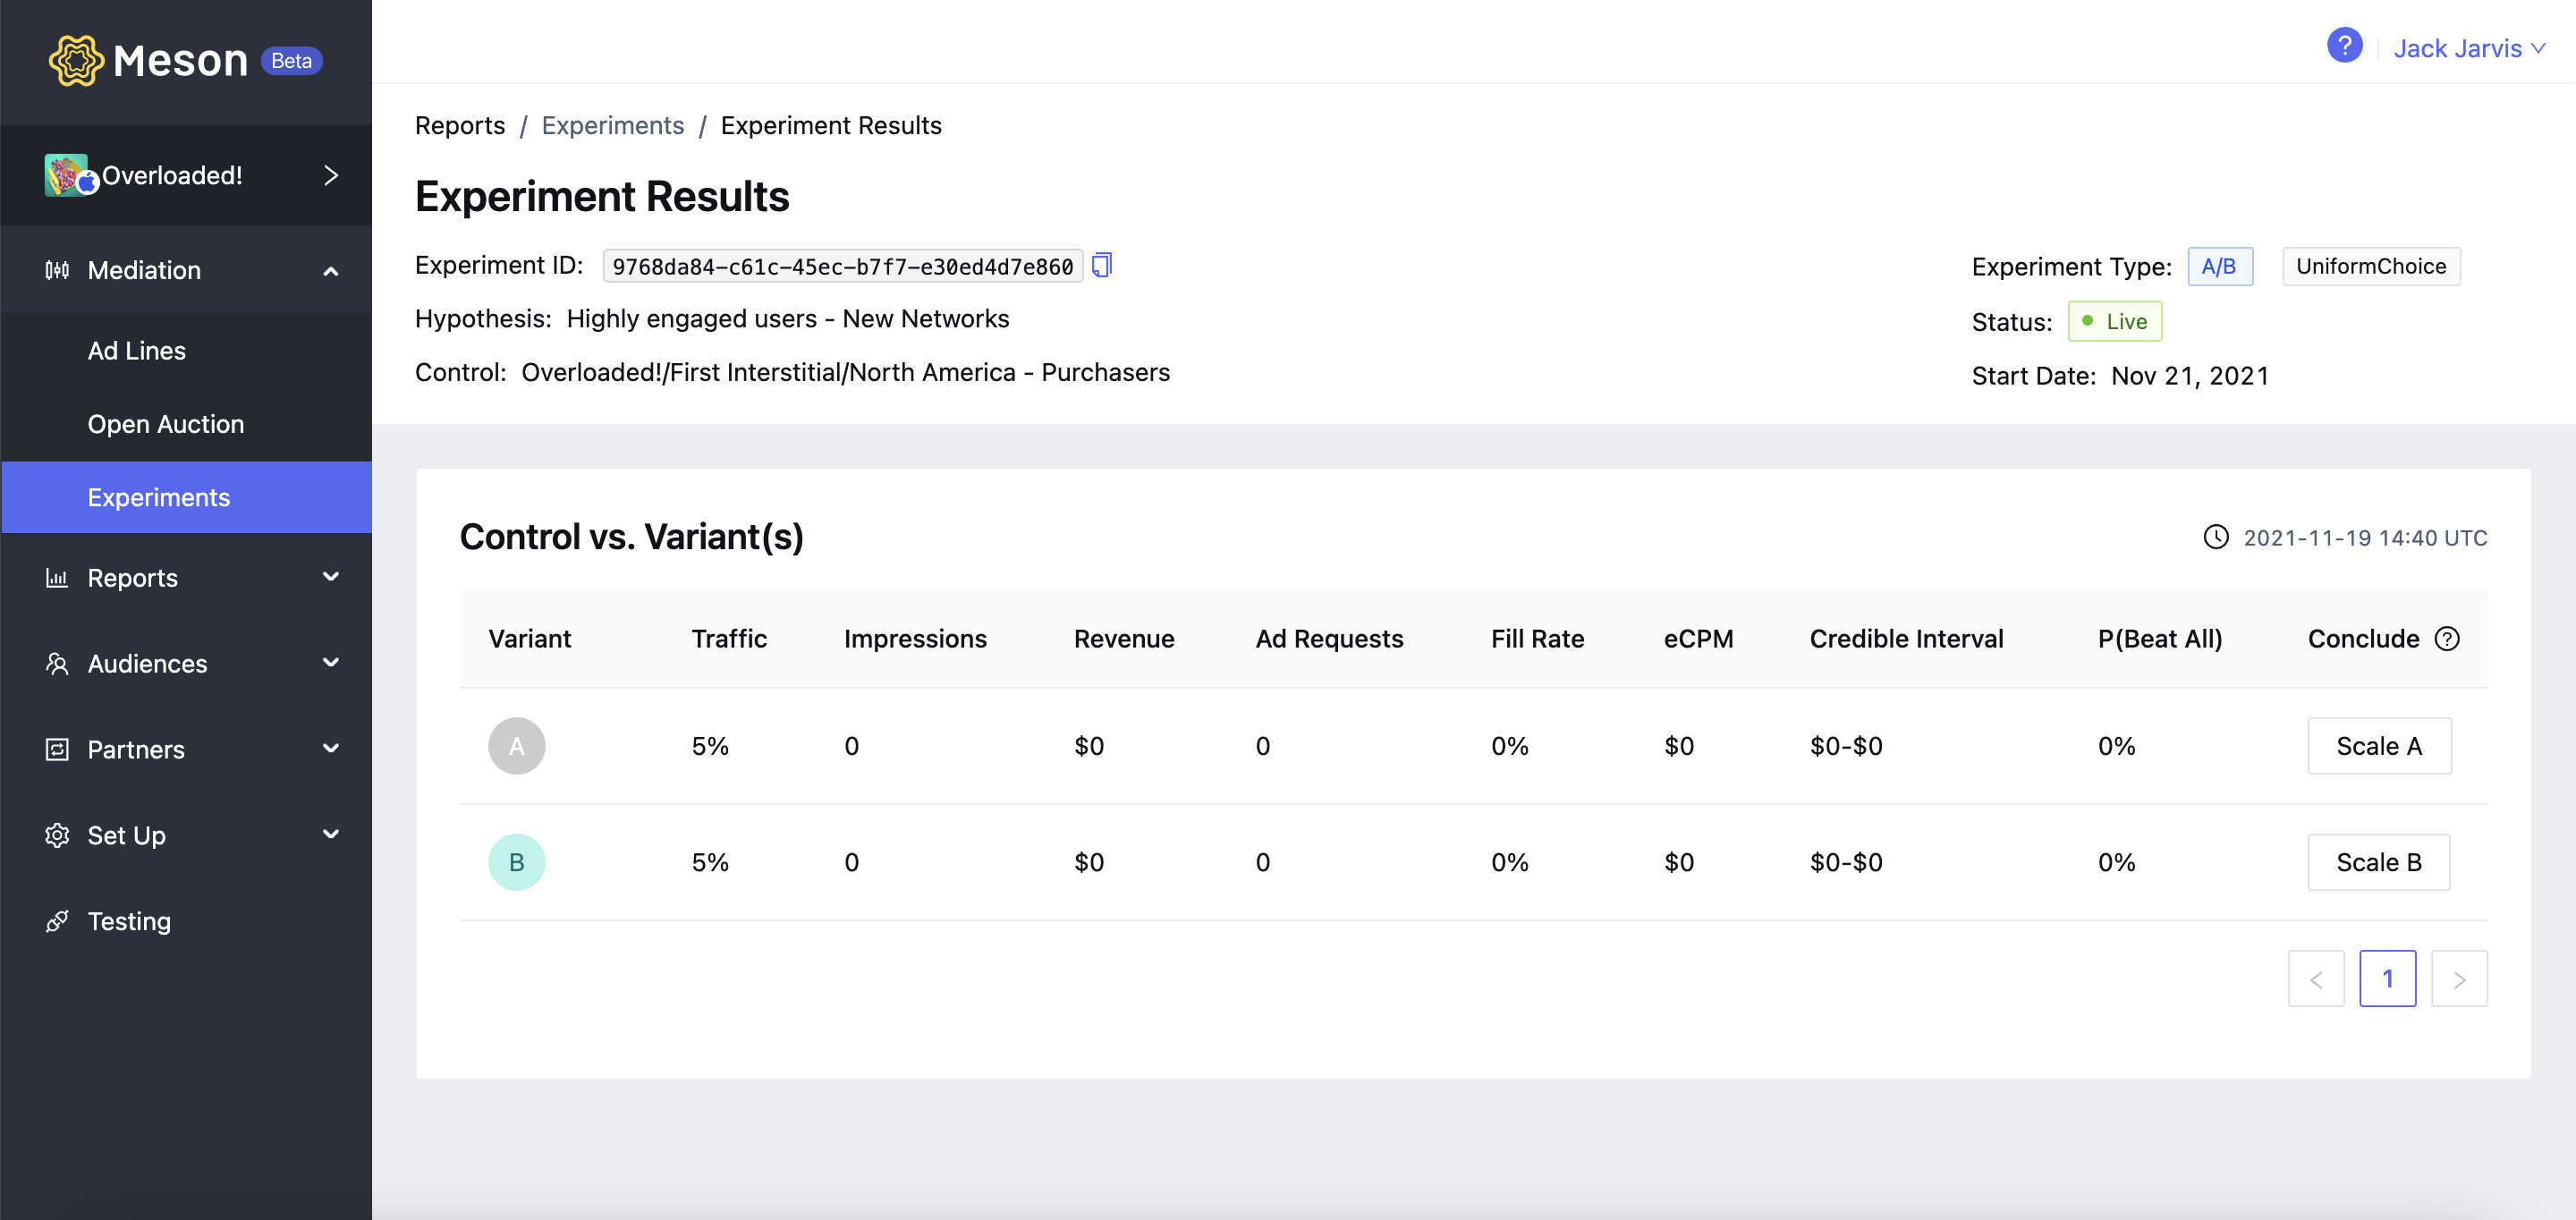
To view experiment results click on the results icon from Results/Experiments for the respective experiment.


The following are reported for each variant:
| Metric | Description |
| eCPM | eCPM reported for treatment, either control or any variant. |
| Revenue | Total revenue reported for treatment, either control or any variant. |
| P(Beat All) | The likelihood that a variant will beat all other variants |
| Impressions | Count of impressions that have been shown to users exposed to a treatment, either control or any variant. |
| Fill rate | Fill rate reported for treatment, either control or any variant. |
| DAU | Count of DAU that have been exposed to a treatment, either control or any variant. |
| Credible Interval | The range in which revenue/impression will fall with a probability of 0.95 for treatment, either control or any variant |
| Ad Requests | Count of ad requests that have been exposed to a treatment, either control or any variant. |
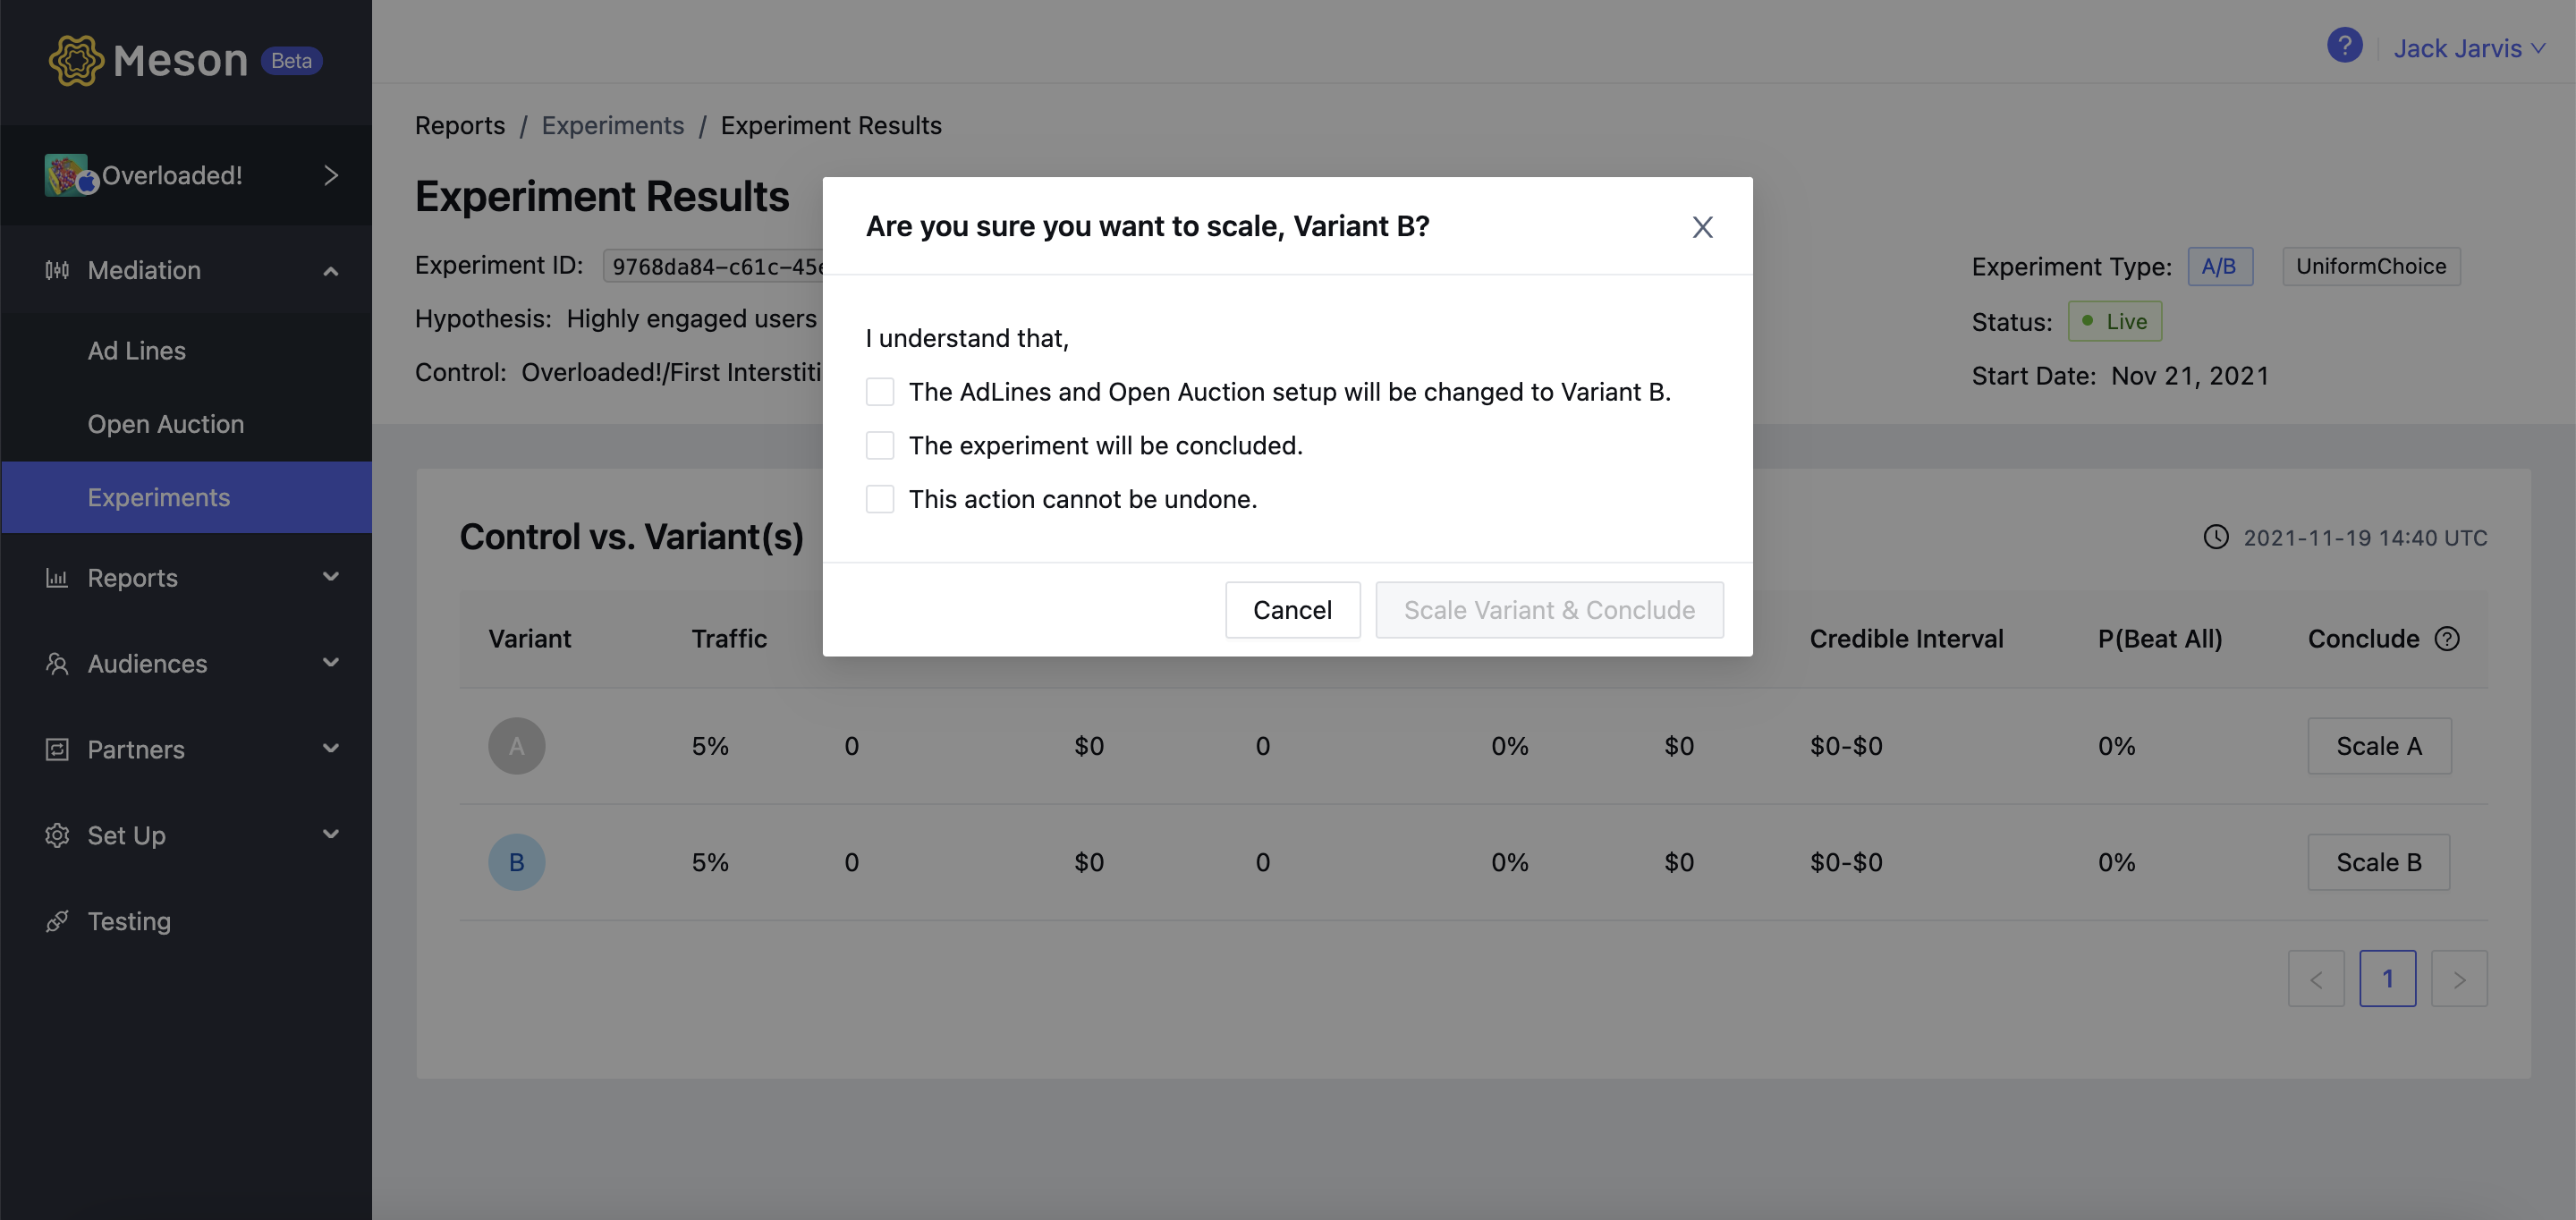
To conclude an experiment, select the variant that is delivering the best results either on the basis of the aggregate metrics or on the basis of the highest P(Beat All). Click on Scale Variant & Calculate.


To start a follow-up experiment from a concluded experiment, go to Reports / Experiments and click on the create icon. This will create a copy of the Concluded experiments in the Draft state. In the draft, state experiments can be edited.


