

 The Basics
 Getting Started
 Open Auction
 Audiences
 Experiments
 Ad Quality
 Integration
 Reports
Meson Analytics offers valuable insights on maximizing your ad revenue to its full potential.
To start, log in to your Meson account. Click Reports > Analytics.
Meson enables you to view analytics for Networks and Requests. The Requests section determines how many requests, fills, impressions, etc are measured on specific ad unit, app, or publisher level. The Networks table measures how many bid requests were sent out, how many bids were received, how many got filled or rendered & other metrics by a specific network.

You can view and generate reports with Dimensions and Measures. Dimensions are attributes by which you filter and group data. Measures are quantifiable metrics that you can track on reports.

Click the "i" icon next to each Dimension and Measure to know more.
Filter allows you to query data only for specific values of Dimensions. Split separates data according to the metrics of your choice. Measure selects the different metrics that you want to measure.
For example, let's say you want to find out the number of Clicks for Banner ads in the last seven days, and you want to group and sort them by Country. This is how it will look:

Data is sorted in descending order by default. Click the arrow beside the Measure to sort by ascending order.
You can visualize data in formats like Totals, Grid, Line Chart, Bar Chart, and Table.
Totals represent the total or exact numerical values you want to measure.

Totals don't require a Split value.
The Grid represents data in columns.
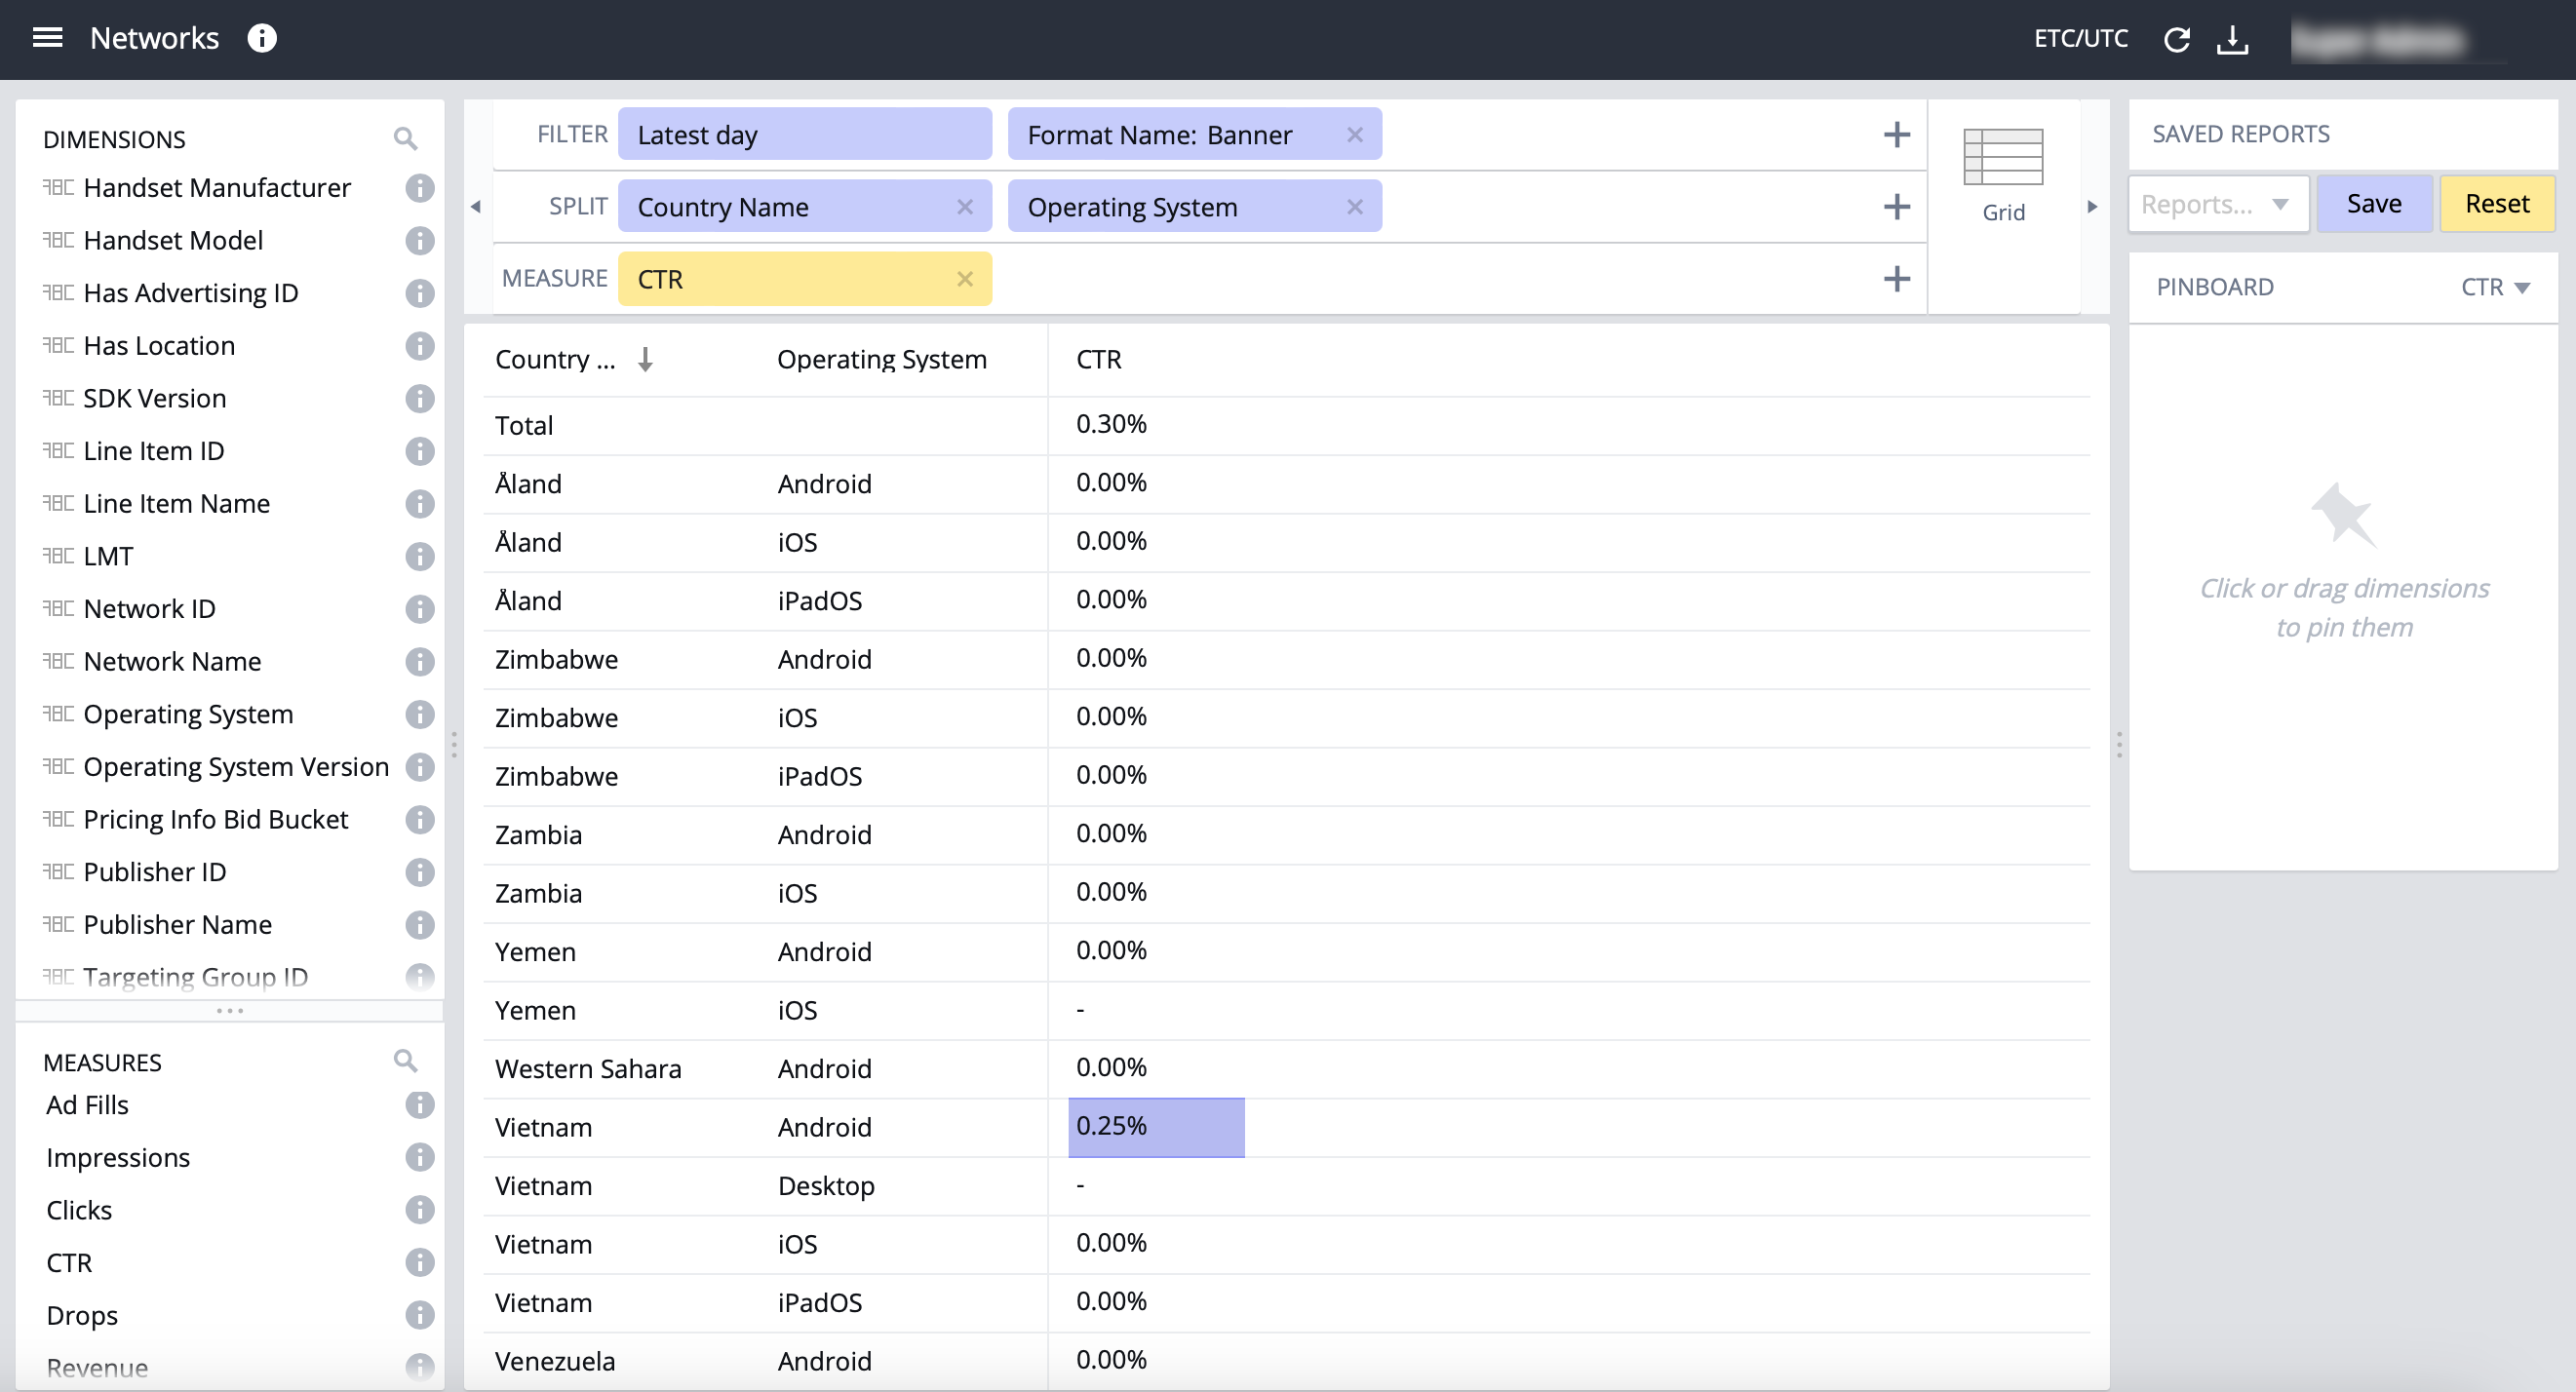
The Grid requires at least one Split.
The Table displays data sorted in columns and filtered one underneath the other.

The Line Chart displays information that changes over time.

The Line Chart requires at least one continuous Split like Time.
The Bar Chart represents data in bars, strips, or columns.

Similar to the Line Chart, the Bar Chart also requires at least one continuous Split.


